Wrzasq.pl was founded in 2009. Over years, we participated in numerous software projects at any scale and stage - from building MVPs up to long-running maintenance; from early startup bootstrapping to corporate scale. We helped many companies start their digital journey from day one, we were trusted by many large companies to take care and improve performance of their existing businesses. Apart from commercial projects, open-source is another field where we also actively participate.
While specializing in cloud projects, we also have broader spectrum of skills and services covering plenty of IT aspects including desktop and mobile applications, web applications, infrastructure and data processing that will enable your organization to better utilize full potential of modern technologies and devices in your company. With our innovative solutions we are always step ahead of the others - you can be there with us!
Cloud enablement
Our main area of expertise is cloud infrastructure and serverless architecture. Lift your company into cloud with us to boost your effectiveness and lower operational costs.
Cloud brings vast spectrum of new possibilities in pair with cost reduction and offloaded maintenance efforts. It cuts off strict connection to the hardware that limits your company bringing you power of virtually infinite resources. Allows you to use modern infrastructure, ensured having always best practices applied, without the need for you to have specialistic competences directly in your teams.
Depending on your flexibility and readiness we can follow lift-and-shift approach, refactor existing technological stack or implement everything with cloud-native, serverless architecture - either by guiding you through that process or taking the whole responsibility to deliver you new, environment fitting your requirements.
Technical consulting
We have extraordinary know-how knowledge base related primarily, but not only, to AWS cloud and utilizing it in web projects, network services but also desktop and mobile applications.
We collected valuable experience over years of participation in various types of projects. Since few years already we focus mainly on AWS cloud and serverless architecture, which is a very modern approach for software design and architecture. In most of the areas, in which we specialize we have certificates that proves our skills and deep understanding of used technologies.
We offer both ad-hoc trainings and long-term consulting services.
IT management
Introducing new paradigms or methodologies into existing teams can cause more troubles if done blindly. Following good practices and proven strategies allows more seamless transition and cost reduction.
Even in technological companies that has a creative and qualified employees there is often a demand for people to govern the processes. We have big experience in software creation not only from development side but also project leading and organizational side following agile methodologies.
Nowadays, when everyone abandons old, ineffective waterfall model in favor of practices based on agile i lean approaches, most of the companies throw it's whole crew in at the deep end hoping they will organize on their own. Self-organization of the teams doesn't mean lack of need of management, only the shift of responsibilities. Even in modern work methodologies there is usually a long and difficult way to go before new process starts working properly and brings benefits for organization. To pass this transformation effectively, and in case of new companies ensure efficient operation from the beginning, it's worth to design, refine and introduce such processes properly. We offer implementation of Scrum methodology guided by certified Scrum Master.
Software development
Tailoring modern software solution to utilize full power of your devices and possibly cloud together empowers your team and allows for better business insights and improving commercial results.
Today computer is basic equipment of each office, institution, or even house. Basic computer skills are mandatory position in a CV, but in fact hardly any company exploits real possibilities, which modern technology gives them. Main purpose of IT companies is to solve problems of everyday work in a way that it helps people with their jobs, not disturbs. Software development process that involves client communication ensures that the result will fit expectations and will pay off faster. We work closely with you, in an agile manner that enables us to react quickly to any of your demands and gives you flexibility to communicate all of your needs as they appear.
Modern systems enables you to analyze, understand and automate a lot of processes of your daily business and cloud platforms like AWS allows them to operate at any scale. You can either delegate full development process to us, or bring us into your existing development team.
Open Source

Commercial projects

Porsche
If you know Porsche, you know it's quality. And to keep it Porsche only works with the best service providers. We work with them to integrate various data sources related to sales, marketing and production processes info unified data lake and allow stakeholders to have insights in one place. All of these processes are being maintained in AWS cloud with full automation, monitoring and privacy protection.
Kambi
We helped Kambi introducing modern DevOps approach to their workflows in projects related to sports data processing. Main focus was put on implementing GitLab CI/CD for workloads designed for AWS data analytics tools (like Glue and Athena).
AUTO1
AUTO1 has a very successful story and is growing rapidly fast. To back all their successes they need to maintain large infrastructure, take care of large personal information quantity and at the same time enable their huge teams to work rapidly on new features and products. We helped them by supporting in dev-ops area, handling AWS deployment automation and CI/CD pipelines maintenance and unification on a large scale.
Doctari
Healthcare industry is a very sensitive part of market but cloud is crucial also to them. While being innovative startup with successful business model, Doctari decided to off-load cloud-enablement process to us and our long-gathered experience in processes automation, virtualizing workloads and cloud infrastructure orchestration.

LEGO
LEGO sales it's products all around the world, producing them in 15 countries - all of this planned to a single brick, day-by-day. And this planning process is supported by us using serverless AWS data processing platform integrated with internal data warehouses and external management systems. Processing gigabytes of data daily across multiple integrated systems to deliver joy for kids all around the globe.

GLS
GLS's R&D hub in Berlin - GLS eCom Lab picked AWS as platform for new projects. Vast amount of new ideas caused a lot of new projects, for which the company needed a lot of specialists. With our certified competences and portfolio of proven achievements GLS delegated to us duties of taking care for delivery-innovation concepts. We work on new logistics products from MVP phase up to maintenance in production.
Siemens AG
Siemens is shifting to serverless architecture.
Our big experience with AWS cloud, deployment and infrastructure automation and serverless architecture gave big confidence to Siemens, which brought us to the project of migration of power plant management software to AWS cloud (fully serverless), which appeared to be a big success and afterwards expanded to more products.
HRS GmbH
Bringing HRS into cloud.
HRS Group had a vision of boosting their products and services with power of cloud. They decided to use our skills and experience to build new, cloud-based platform that could serve all of their portfolio products with uniform data handling, automated deployment processes, data ingestion solutions.
Rocket Internet SE
Marketing automation for hundreds of millions of customers monthly.
Our mission was to build a generic marketing automation solution (by means of all aspects including frontend, backend, infrastructure, automation etc.) delivered to all Rocket Internet ventures. Our software covered all steps of marketing communication with e-commerce (and also other) customers - starting from external tools integration, through data processing and enrichment to multichannel communication. Product was deployed to over 20 business entities; integrated tens of different subsystems; used to process, handle and govern entirely marketing communication with hundreds of millions customers worldwide.
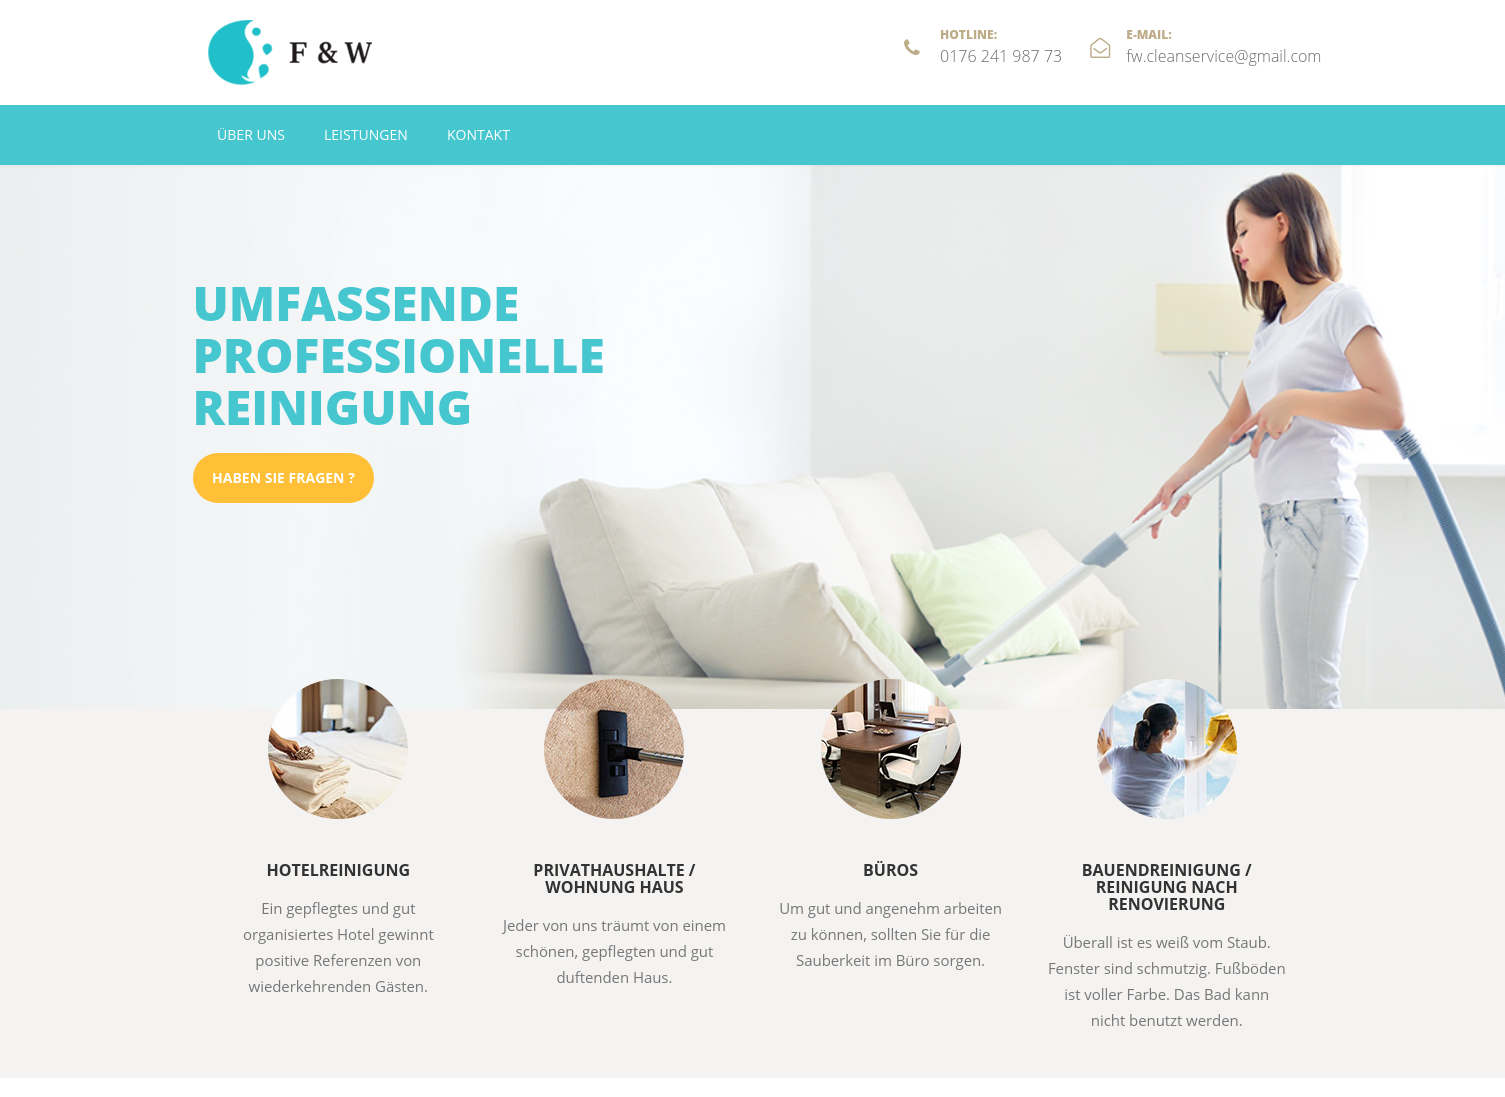
FW - F & W
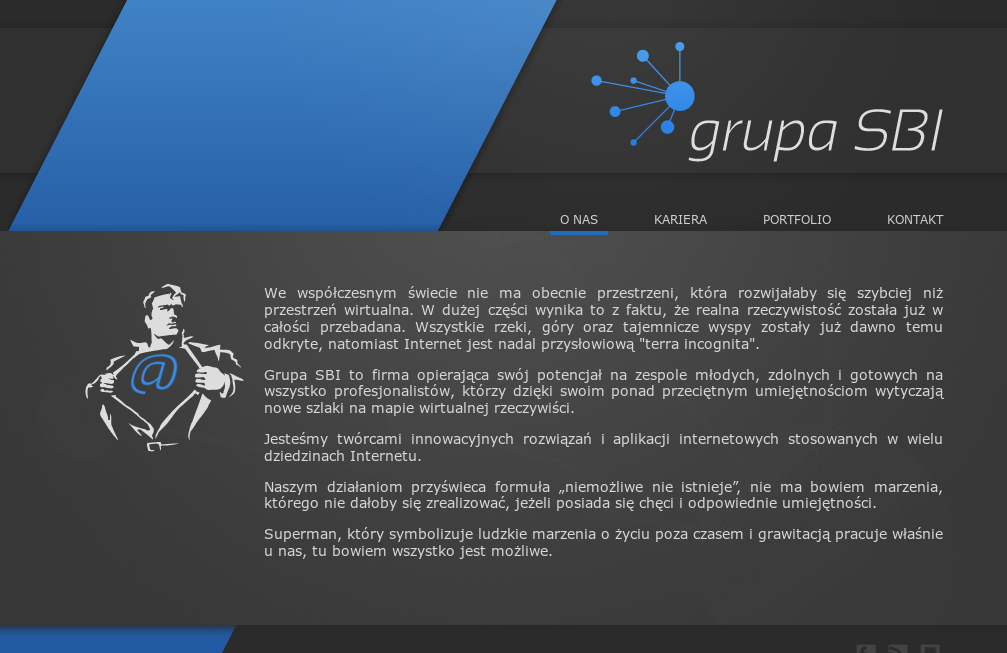
Grupa SBI
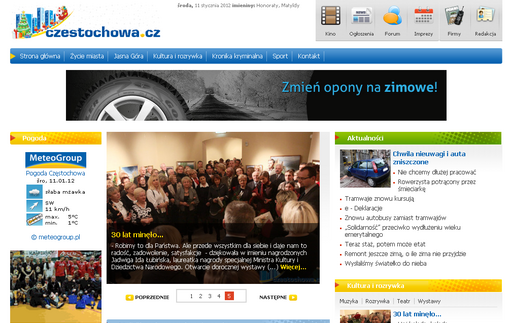
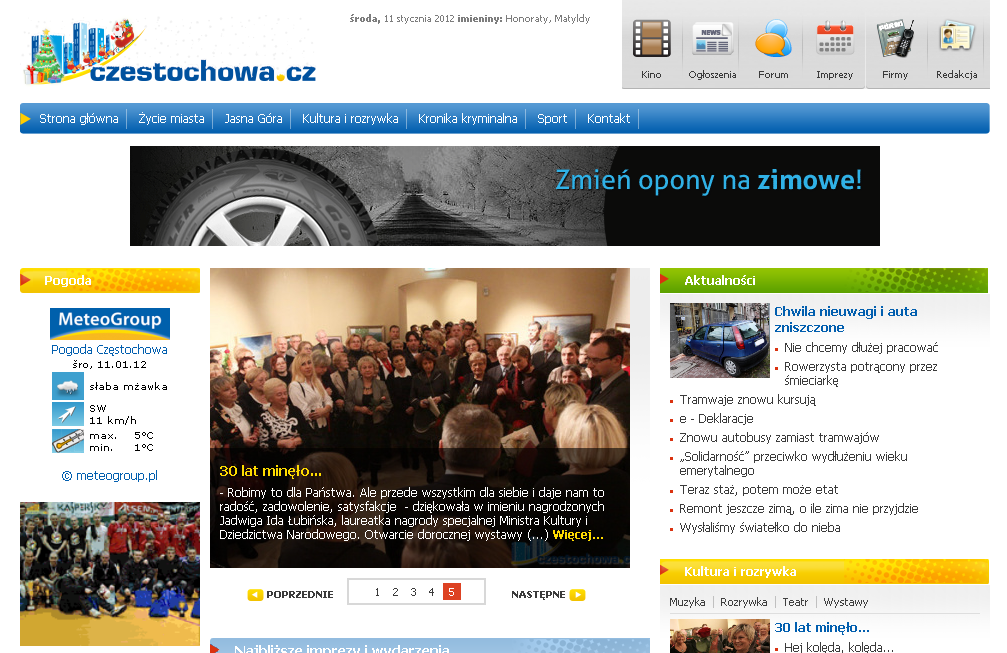
Czestochowa.cz
Pies.tv


WallpapersPro

Groupeal
Anioły Biznesu

Inwestycja w Kadry
Brabud

Ekom
Establishing network infrastructure based on Linux/Samba servers working with Windows XP workstations.
Perfect example of cost reduction paired with technological progress. Company's servers were migrated to open-source Linux system with Samba software, that enabled them to work seamlessly with connected Windows workstations. Such setup not only lowered software licence costs, but also enabled company to introduce new technical solutions such as remote access, sharing documents with partners or backups automation.
Nieruchomości BES
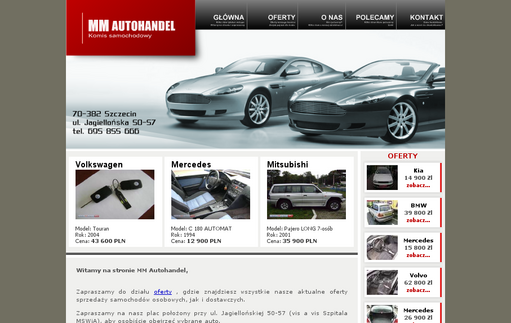
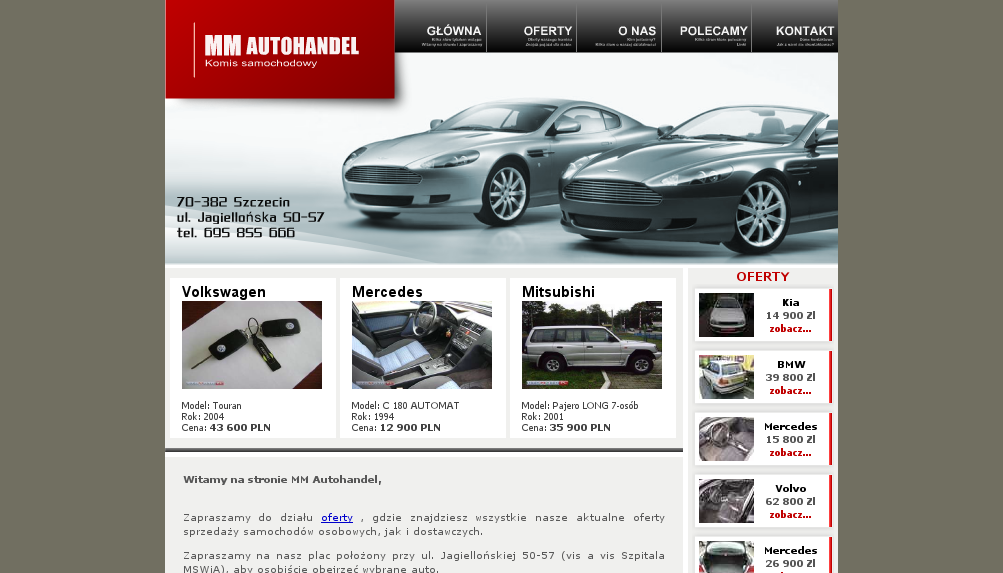
MM Autohandel
PracaNadMorzem.pl
WoW Locator
PalmSoftware.org
Herbal Circle
Norbain
iKancelaria
Contact
If you are interested in our services or got any questions, feel free to use any of the following means to contact us directly. You can also find here any of the information required for legal and billing purposes.
- E-mail:
- office@wrzasq.pl
- Web:
- https://wrzasq.pl/
- Mobile:
- +48 605 071 040
Rafał Wrzeszcz - Wrzasq.pl
- Address:
- Jerzego Janosika 13/3
71-424 Szczecin
zachodniopomorskie, Poland - EU VAT ID:
- PL 8513059161
- REGON:
- 320627470
- IBAN:
- PL 76 1140 2004 0000 3402 5987 9453 (PLN)
PL 62 1140 2004 0000 3712 0595 3247 (EUR)
PL 40 1140 2004 0000 3312 0872 6681 (USD)